Hannaian Intellectual Property Stock (HIPS)
Research Analysis & Progress Report

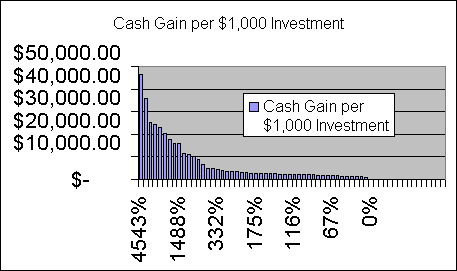
These charts gives tracking information on stocks covered and reported in the Hannaian Intellectual Property Stock (HIPS) Research Focus. Results are based on potential purchases per $1,000 on stock bought at the intial price when first researched and sold at the highest price attained during our coverage through the last review date. Calculations are based on a buy and hold strategy. Trading a stock may have produced higher or lower results. In some cases additional gains were possible by buying an issue at a lower price than the initial coverage price. These progress charts represent the general progress and efficacy of the research service. Each individual's progress may be significantly different based on their trading skills, business approach, and work effort.


The following information is based on returns from a one thousand dollar investment ($1,000).
  1. Code

Date Coverage Initiated

Price at Start of Coverage

Highest Price Since Coverage (Splits Included)

Date of Highest Price Attained

Dollar Amount Gained Per Share

Percentage (%) Gain

# Shares per $1,000

Cash Gain per $1,000 Investment

9810151

10/15/98

$ 0.21

$ 9.75

4/30/99

$ 9.54

4543%

4,761.90

$46,428.57

9809091

9/9/98

$ 1.25

$ 45.00

12/9/99

$ 43.75

3500%

800.00

$36,000.00

9802012

2/1/98

$ 7.31

$ 186.00

12/10/99

$ 178.69

2444%

136.76

$25,437.64

*9906101

6/10/99

$ 0.75

$ 18.38

12/9/99

$ 17.63

2350%

1,333.33

$24,500.00

9802012

2/1/98

$ 4.91

$ 113.00

12/10/99

$ 108.09

2201%

203.67

$23,014.26

9811013

11/1/98

$ 0.30

$ 6.06

4/5/99

$ 5.76

1921%

3,333.33

$20,206.67

9802021

2/2/98

$ 2.06

$ 36.23

12/10/99

$ 34.17

1657%

484.97

$17,572.26

9811011

11/1/98

$ 2.94

$ 47.00

11/30/98

$ 44.06

1500%

340.43

$16,000.00

9801271

1/27/98

$ 0.12

$ 1.91

5/1/98

$ 1.79

1488%

8,333.33

$15,883.33

9818061

6/18/98

$ 2.06

$29.00

12/08/99

$26.94

1306%

484.85

$14,060.61

9905101

5/10/99

$ 5.56

$ 64.25

12/10/99

$ 58.69

1055%

179.78

$11,550.56

9802041

2/4/99

$ 1.38

$ 14.94

6/24/98

$ 13.56

986%

727.27

$10,863.64

9810012

10/1/98

$ 2.81

$ 29.00

3/31/99

$ 26.19

931%

355.62

$10,312.94

9811171

11/17/99

$ 0.34

$ 3.00

10/1/99

$ 2.66

775%

2,915.45

$ 8,746.36

9910211

10/21/99

$ 0.60

$ 3.94

10/26/99

$ 3.34

556%

1,666.67

$ 6,561.67

9806291

6/29/99

$ 1.47

$ 7.25

4/14/99

$ 5.78

394%

680.85

$ 4,936.17

9904301

4/30/99

$ 0.56

$ 2.75

5/24/99

$ 2.19

389%

1,779.36

$ 4,893.24

9904263

4/26/99

$ 2.56

$ 11.06

12/10/99

$ 8.50

332%

390.24

$ 4,317.07

9809161

9/16/98

$ 0.88

$ 3.50

3/24/99

$ 2.63

300%

1,142.86

$ 4,000.00

9905051

5/5/99

$ 0.50

$ 1.88

5/12/99

$ 1.38

275%

2,000.00

$ 3,750.00

9809031

9/3/98

$ 0.88

$ 3.15

1/15/99

$ 2.28

260%

1,142.86

$ 3,600.00

9911051

5/11/99

$ 0.90

$ 3.19

12/9/99

$ 2.29

254%

1,111.11

$ 3,541.67

9802011

2/1/98

$ 3.88

$ 13.00

1/11/99

$ 9.13

235%

258.06

$ 3,354.84

9908031

8/3/99

$ 0.63

$ 2.00

8/31/99

$ 1.38

220%

1,600.00

$ 3,200.00

9810011

10/1/98

$ 5.88

$ 18.44

12/6/99

$ 12.56

214%

170.21

$ 3,138.21

9811012

11/1/98

$ 0.75

$ 2.13

2/4/99

$ 1.38

183%

1,333.33

$ 2,833.33

9907301

7/30/99

$ 0.19

$ 0.52

10/1/99

$ 0.33

175%

5,347.59

$ 2,754.01

9810011

10/1/98

$ 11.63

$ 31.19

7/19/99

$ 19.56

168%

86.02

$ 2,682.75

9811011

11/1/98

$ 10.38

$ 27.13

7/20/98

$ 16.75

161%

96.39

$ 2,614.46

9810011

10/1/98

$ 3.00

$ 7.63

1/25/99

$ 4.63

154%

333.33

$ 2,541.67

9903241

3/24/99

$ 1.69

$ 4.25

12/6/99

$ 2.56

152%

592.77

$ 2,519.26

9904261

4/26/99

$ 9.94

$ 23.00

11/15/99

$ 13.06

131%

100.63

$ 2,314.58

9912011

12/1/99

$ 3.47

$ 7.75

12/10/99

$ 4.28

123%

288.35

$ 2,234.72

9912053

12/5/99

$ 5.06

$ 11.25

12/8/99

$ 6.19

122%

197.55

$ 2,222.44

9712012

12/1/97

$ 2.78

$ 6.00

11/29/99

$ 3.22

116%

359.58

$ 2,157.50

9912052

12/5/99

$ 2.25

$ 4.75

12/10/99

$ 2.50

111%

444.44

$ 2,111.11

9801301

1/30/98

$ 2.23

$ 4.50

4/16/99

$ 2.27

101%

447.63

$ 2,014.32

9811301

11/30/98

$ 1.00

$ 2.00

6/9/99

$ 1.00

100%

1,000.00

$ 2,000.00

9810013

10/1/98

$ 10.75

$ 21.44

1/13/99

$ 10.69

99%

93.02

$ 1,994.14

9912051

12/5/99

$ 0.16

$ 0.30

12/9/99

$ 0.14

90%

6,402.05

$ 1,900.13

9802021

2/2/98

$ 4.19

$ 7.00

2/12/99

$ 2.81

67%

238.83

$ 1,671.84

9906151

6/15/99

$ 0.19

$ 0.31

9/28/99

$ 0.13

67%

5,347.59

$ 1,668.45

9904262

4/26/99

$ 0.44

$ 0.69

4/27/99

$ 0.25

57%

2,285.71

$ 1,571.43

9808011

8/1/98

$ 5.56

$ 8.53

11/16/98

$ 2.97

53%

179.86

$ 1,534.35

9711011

11/1/97

$ 12.00

$ 16.50

11/23/99

$ 4.50

38%

83.33

$ 1,375.00

9905111

5/11/99

$ 0.69

$ 0.94

7/22/99

$ 0.25

36%

1,454.55

$ 1,363.64

9911101

11/10/99

$ 1.04

$ 1.25

12/7/99

$ 0.21

20%

961.54

$ 1,201.92

9906151

6/15/99

$ 0.25

$ 0.30

7/8/99

$ 0.05

19%

4,000.00

$ 1,187.50

9906152

6/15/99

$ 0.39

$ 0.42

11/19/99

$ 0.03

8%

2,564.10

$ 1,076.92

9904261

4/26/99

$ 3.13

$ 3.13

4/26/99

$ -

0%

320.00

$ -

9905151

5/15/99

$ 0.11

$ 0.11

5/15/99

$ -

0%

9,523.81

$ -


* This stock was available at two cents per share ($.02) just a few months prior to its coverage by Hannaian. A one thousand dollar investment at that time in Feburary 1999 would have returned $919,000.00 on December 9, 1999.


Total Number of Stocks Covered

51.00


Number of stocks gaining more than 50%

44.00


Percentage of stocks gaining more than 50%

86%


Number of stocks gaining more than 100%

39.00


Percentage of stocks gaining more than 100%

76%


Number of stocks gaining more than 300%

19.00


Percentage of stocks gaining more than 300%

37%


Number of stocks gaining more than 1000%

11.00


Percentage of stocks gaining more than 1000%

22%

Overall Average Percentage Gain

636%

Overall Average Cash Gain

$7,321.87

ChartObject Cash Gain per $1,000 Investment


Last Updated on 12/11/99
By Hannaian Publishing
Email:
StockProgress@hannaian.com